How Hard is it to Get Into Veterinary School? A Look at the Acceptance Rate

Lori Hehn is a practicing veterinarian and has a drive for continual learning and enjoys interacting with veterinary and vet tech students. She also writes veterinary learning books for children.

You have heard that it is nearly impossible to get into veterinary school. But, what odds are you looking at? Have you already been accepted? If so, Congratulations!
First, let’s consider an acceptance rate:
- There is a certain number of applicants, and out of this comes the number of actual qualified applicants. Schools have different requirements regarding the number of letters of recommendation, classes/credits taken, GPA, scores on the GRE, etc. and all requirements must be fulfilled to be considered. Note that the number of applicants listed in the chart below does not specify applicants vs. qualified applicants (as the website data from these schools doesn’t always make that clear). The majority are qualified applicants, but it is important to point out this fact when interpreting the information.
Download The eBook: The 7 Cardinal Rules Every Applicant Should Know When Applying to the VIRMP |

- Out of the qualified applicants comes the number of people who are offered a position. This doesn’t mean that all of those who are offered a position will take it. That being said, there is usually a standard class size per school. So if one person does not accept a position, the position is then offered to the next candidate on the list.
There are 30 accredited veterinary schools in the United States. I have compiled a chart with some basic numbers taken either directly from the school’s website. Most of these schools have up to date statistics on their websites, but a few have missing numbers or outdated numbers. With that in mind, please view this as an overall average.
| Veterinary School: | Number of Applicants: | Number Admitted: | Percent Acceptance: |
| Colorado State | 1,150 | 138 | 12 |
| UC Davis | 730 | 140 | 19.2 |
| Ohio Sate | 1417 | 162 | 11.4 |
| Texas A&M | 510 | 138 | 27 |
| Wisconsin | 1267 | 87 | 6.9 |
| Cornell (outdated 2007/2008) | 887 | 86 | 9.6 |
| Minnesota | 910 | 102 | 11.2 |
| Kansas | 1194 | 112 | 9.4 |
| Georgia | 834 | 102 | 12.2 |
| Missouri | 942 | 120 | 12.7 |
| Michigan | 901 | 113 | 12.5 |
| Louisiana | 798 | 88 | 11 |
| Purdue | 777 | 84 | 10.8 |
| Iowa | ??? | 148 | |
| Florida | 867 | 110 | 12.7 |
| Washington | 1169 | 133 | 11.4 |
| Western Health Sciences (Pomona, CA) | 872 | 105 | 12 |
| Auburn | 1,111 | 120 | 10.8 |
| North Carolina State | 905 | 100 | 11 |
| Virginia | 1226 | 120 | 9.8 |
| Tufts | 1106 | 98 | 8.8 |
| Penn | 1533 | 123 | 8 |
| Tuskegee | No info available | ||
| Oklahoma State | 846 | 106 | 12.5 |
| Illinois | 900 average | 130 | 14.4 |
| Mississippi | 950 average | 85 | 9 |
| Oregon | 970 | 69 | 7 |
| Tennessee | 858 | 83 | 9.7 |
| Midwestern University | ??? | 114 | |
| Lincoln Memorial | ??? | 115 |
Average Acceptance Rate: 11.7%
So, even with some discrepancy, it is safe to say that on average there is about a 10-15% acceptance rate to vet school. This will largely depend upon the number in the original applicant pool and how many positions are offered. If you are considering applying to vet school, check back soon for a post about how to maximize your chance for acceptance!
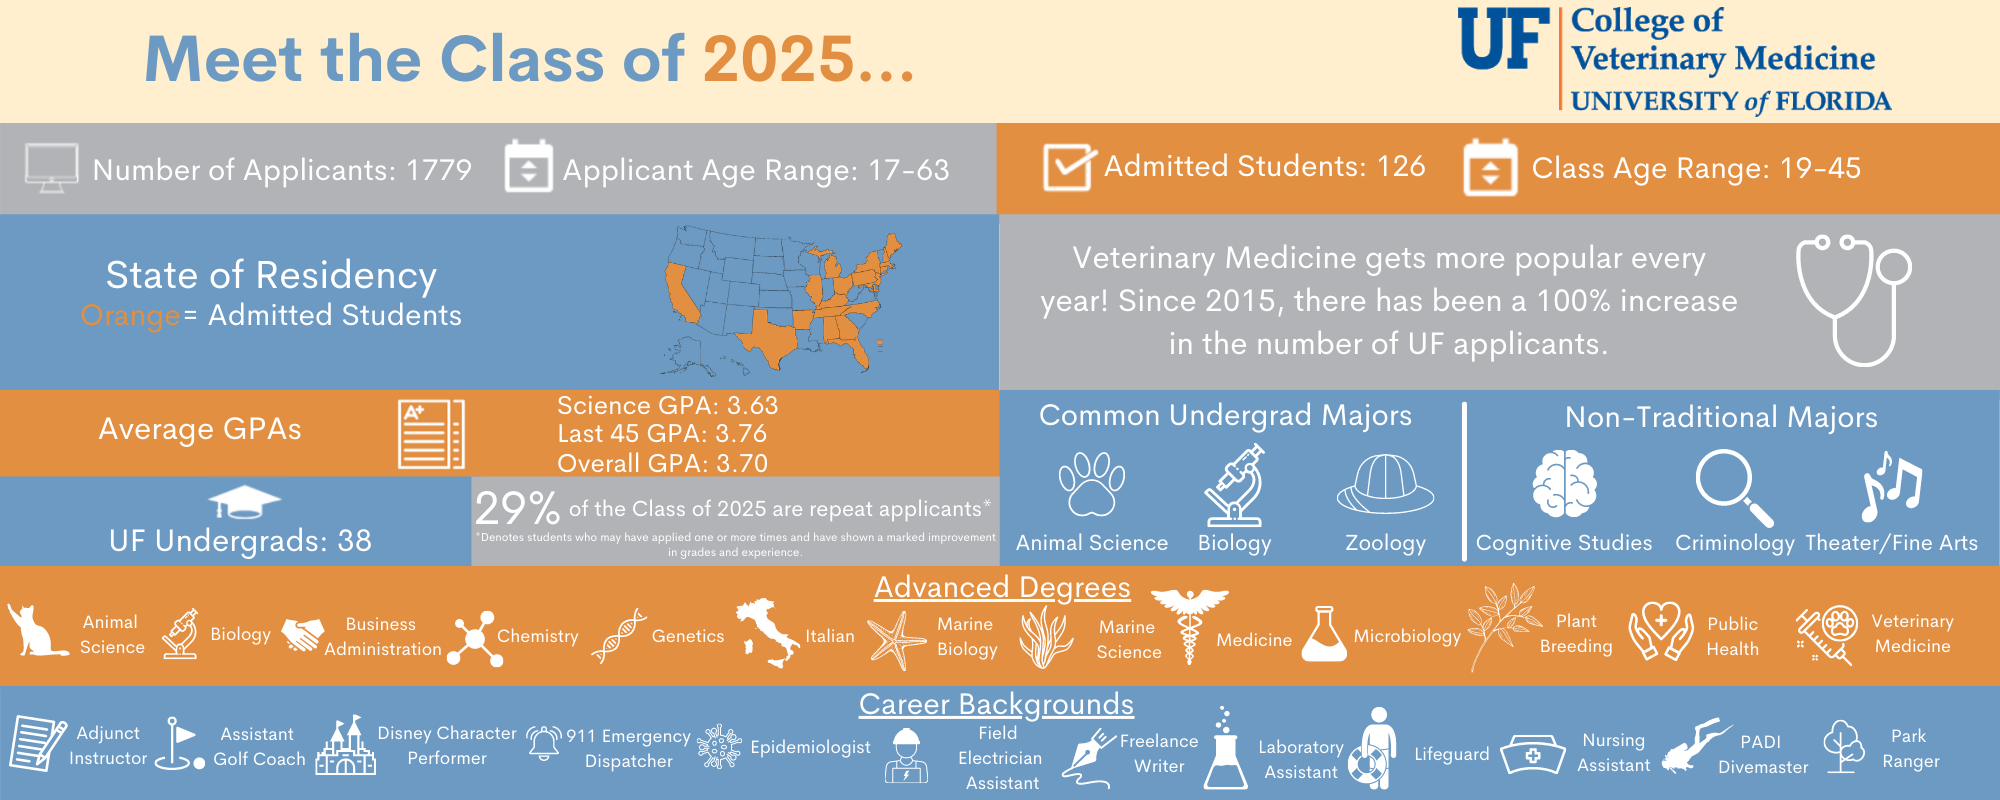
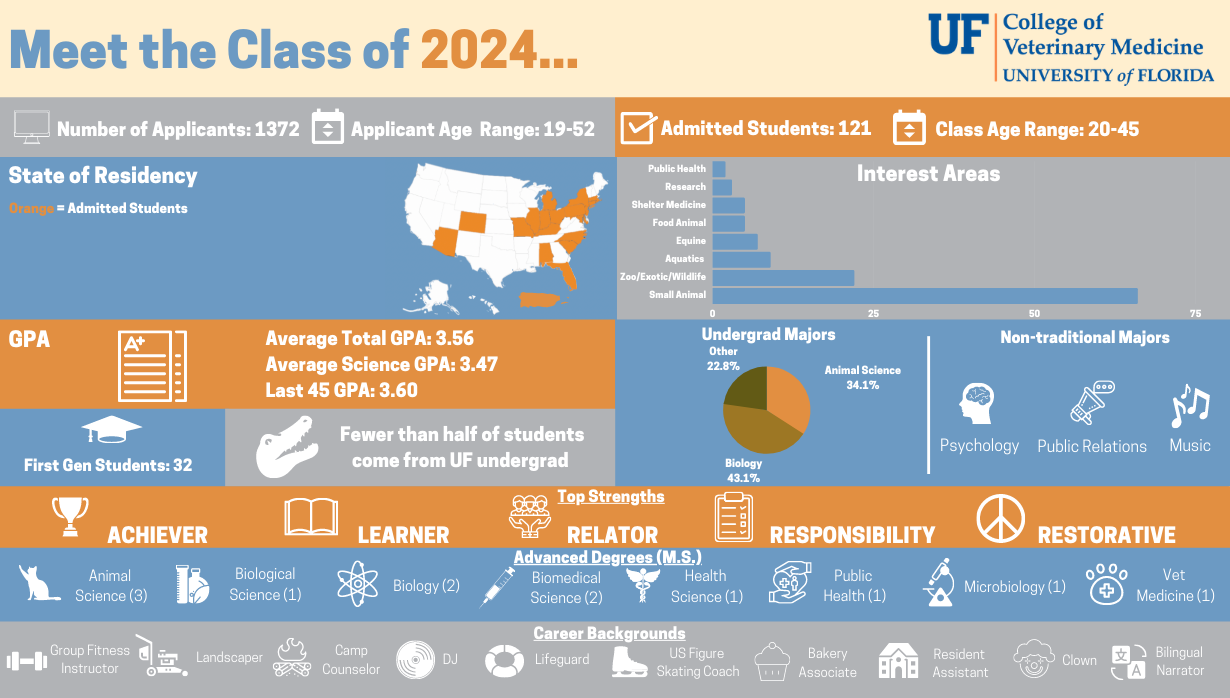
Admitted Class Statistics

UF COLLEGE OF VETERINARY MEDICINE
Applicant pool profiles
Learn about our recent applicant pool profiles outlining GPA averages, class demographics, institutions attended, degrees earned and much more. No preference is given to majors or undergraduate institutions in the admissions process. Note: Starting with the 2019-2020 admissions cycle, the GRE test is no longer required for admission.
Class of 2025 Student Profile

Class of 2024 Student Profile

Leave a Reply